X
Canada
The expanded rollout of our Organics Recycling Program has contributed to a 25 percent increase in total tonnage of organic waste diverted from landfill. We also increased food donations by 64 percent over 2013 and redirected an additional 142,552 kg of products to people in need.
X
U.S.
We collaborate with organizations to direct recyclable waste materials from our stores into the manufacturing of new products that come back to our shelves:
- We work with manufacturer Technimark to recycle our softlines hangers into new retail hangers for sale at our stores and clubs. In 2014, this program was responsible for 30 percent of the private-label hangers we sold.
- We collaborate with Pioneer Products to collect used icing buckets from our bakery departments and recycle them into 45-gallon trash cans. Last year, 215,793 icing buckets were recycled and incorporated into 351,130 trash cans.
X
Mexico
Our waste reduction campaign Reduce, Recycle and Win helped us reduce food waste by 6 percent in Mexico stores and increase the amount of recyclables (cardboard and stretch film), as compared with 2013. Additionally, a Committee of Freshness was created to help improve the delivery of fresh food to our customers and reduce food throwaways.
X
Central America(Costa Rica, El Salvador, Guatemala, Honduras, Nicaragua)
Through reverse logistics, we increased the total weight of materials collected for recycling by 10.8 percent in 2014, for a total of 21,388 metric tons. The categories of recyclable materials being collected has grown to include cardboard, paper, stretch film, plastic bags, rigid and PET plastics, metals, aluminum, pallets, glass, vegetable oil and electronics.
X
Chile
In 2013, we collaborated with four multi-national organizations to create a network of five recycling points for the metropolitan region. From November 2013 to December 2014, the recycling points collected 166,328 kg of waste that was diverted from landfills.
X
Argentina
In 2014, we donated 141,612 kilos of nonperishable food, hygiene and cleanliness products to food banks across the country. We also recycled 47,000 kilos of cardboard and 8,487 kilos of plastic through reverse logistics.
X
Brazil
To date, Walmart Brazil has more than 200 collection points to encourage customers to bring back their recyclables: glass, paper, cardboard, plastic and metal. In 2014, we also piloted the collection of expired medicines, batteries, light bulbs and used mobile phones. In cooperation with approved partners, Walmart Brazil collected and responsibly disposed of 850 kg of expired medicine and recycled 5,752 kg of batteries and mobile phones last year.
X
U.K.
With the opening of the ninth Asda Service Centre in 2014, all Asda stores in England, Scotland and Wales are returning recyclables and food waste via reverse logistics.
X
Africa
Currently, Makro, in partnership with Samsung, facilitates South Africa’s largest retail-led e-waste collection program. Makro-Samsung e-waste collection containers have been made available across 18 stores to assist customers with recycling and the safe disposal of e-waste. To date, the program has supported the collection of more than 596 tons of post-consumer e-waste.
X
India
Best Price stores in India offer customers available used cardboard boxes to pack merchandise they’ve purchased. This helps to significantly reduce the use of plastic bags.
X
Japan
We expanded our food donation program to 30 new stores in 2014, bringing it to a total of 81 stores by the end of the year. In 2014, we donated more than 100,000 items through our partnership with Second Harvest Japan.
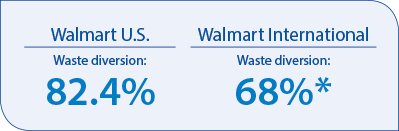
*Based on review of material-handling and waste-diversion processes in Argentina, Brazil, Canada, Central America, Chile, Japan, Mexico, South Africa and the U.K. Numbers reported by waste vendors, food banks and stores. In cases where real numbers were not available due to industry challenges, they have been estimated based on industry acceptable standards.
UL Environment, part of the UL family of companies, was commissioned by Wal-Mart Stores, Inc., to undertake verification of the company’s global waste diversion results. The objective of the verification was to establish that the waste diversion information presented by the company is a reliable representation of Wal-Mart Stores, Inc.’s performance and programs, and that the data presented conforms to Walmart’s own stated Waste Diversion Program. UL Environment reviewed material handling, diversion processes and select supporting data through discussions and interviews with our internal Walmart Zero Waste Global Sustainable Value Network, document reviews and analytic reviews of waste diversion procedures. Based on the assurance activities undertaken for the United States, UL Environment found no evidence to indicate that the diversion rates reported are materially inaccurate. Based on the assurance activities undertaken for the U.K., Chile, Central America, South Africa and Japan, UL Environment found no evidence to indicate that the processes applied would result in material misstatements of diversion rates. Analysis of the diversion data for these markets is ongoing. UL Environment conducted the verification process in accordance with procedures adapted from the Greenhouse Gas international assurance standard, ISO 14064-3, and UL’s Environmental Claim Validation Procedure 2799, Zero Waste to Landfill.
Mexico, Canada, Brazil and Argentina numbers are self-reported.
Aspiration
Walmart will reduce food waste in emerging market stores by 15 percent and in our other markets by 10 percent by the end of 2015, compared with our 2009 baseline.
In emerging market stores (Argentina, Brazil, Central America, Chile and Mexico), we’ve reduced food throwaway by 11% percent.
While we continue to work toward reducing food waste in our developed markets (Canada, Japan, the U.K. and the U.S.), we’re at risk of not meeting our goal of 10 percent reduction by 2015. As the demand for high-quality, fresh meat and produce has increased in developed markets such as Canada and the U.S., we’ve expanded our offering and our volume of food. But with more volume and better quality comes the potential for additional waste. We continue to work with our associates to improve our processes for managing our fresh food offering and drive results. Several success stories from our global markets are shared below.
Central America
Our focus on waste prevention at every stage — from supply chain and transportation to our own distribution centers and stores — has contributed to a 20 percent reduction in our food throwaway rate compared with our 2010 baseline. Through the development of programs like Safe and Great Exhibition Basics and tools like the Perishables Damage Item Thermometer, we’re making it easier for our associates to prevent food waste at the store level. In 2014, every operator tracked food waste reduction metrics and our stores assigned a food waste reduction champion to drive efficiency in perishable departments.
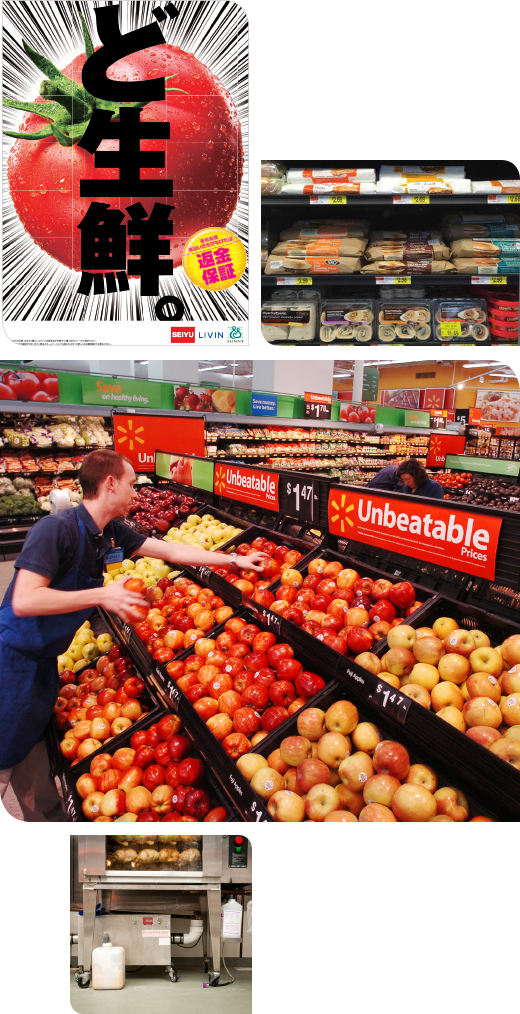
Japan
By the end of 2014, we reduced operational food waste by 63 percent, compared with our 2009 baseline. Last year, we launched the Fresh Food Satisfaction Guarantee Program, where store associates performed more frequent freshness checks and timely markdowns. It helped to increase fresh food sales by approximately 8 percent year-over-year, while reducing food throwaway by 30 percent.
U.S.
In September 2014, Walmart U.S. launched an internal food waste and damage reduction campaign that focuses on forecasting optimization, packaging improvement, optimization of displays and the activation of a Customer Value Program. In 2014, the campaign helped keep an estimated 30 million units of food from becoming waste relative to growth rate projections. In 2015, we’ll conduct training on stocking, rotation, back stock, sales floor management and more.
Challenges: Waste Reduction
We’re focused on three waste-related challenges:
- Providing standardized and consistent reporting through better processes and data to drive progress and results.
- Addressing fragmentation within the industry by building scale at the regional or country level to improve the economics and the sustainability of these commodity streams.
- Leveraging our own operations and developing partnerships to solve infrastructure needs that will lead to better outcomes.