

No synthetic
fertilizer
Common
Values
Operations


UNSDG

A Winning Idea
For employees across CF operations, staying safe is a team effort
That commitment is clear among the finalists for our annual Stephen R. Wilson Excellence in Safety Award. The award challenges teams of employees to propose ideas that could improve safety across CF. Now in its fourth year, it continues to represent our individual and collective commitment to safety and our focus on finding new ways to “Do It Right.”
A Winning Idea at Woodward
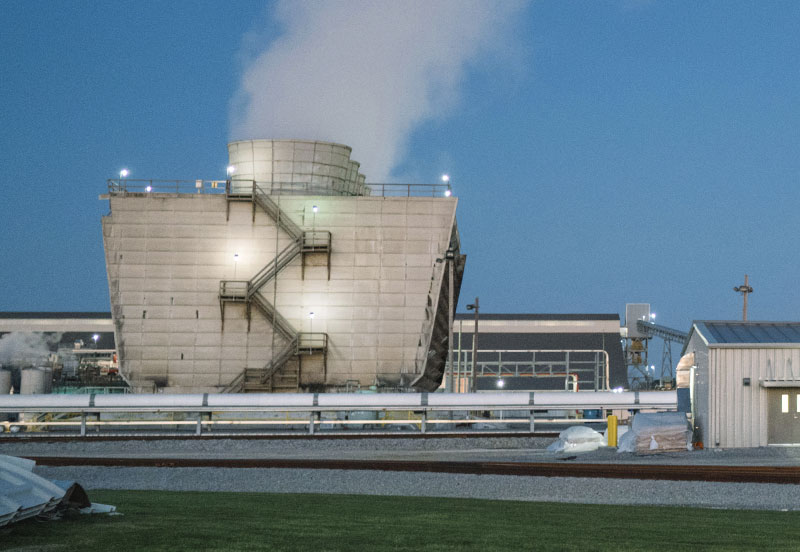
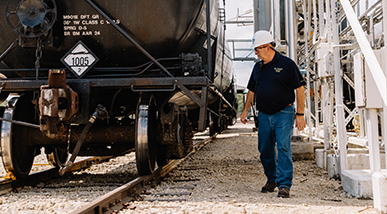
When Instrumentation and Electrical (I&E) Technician Lincoln Gaisford was called in to replace a fan on a cooling tower motor at CF’s Woodward, Oklahoma, Nitrogen Complex, he did what techs across the industry have always done. He locked out the equipment, removed the cover from the back of the motor to gain access to the driveshaft, then pressed a wooden 2X4 against the drive line to stop its motion. He then secured the shaft with a strap and got to work.
There was just one problem — the shaft was connected to cooling fans with blades 30 feet across. Even when switched off and locked out, an updraft can cause the blades to move again with a force that is beyond techs’ control. That’s exactly what happened to Gaisford as he and his partner worked.
The incident was a wake-up call, and engineers at Woodward agreed that there had to be a better way. I&E Planner Nathan Rose and Maintenance Engineer Buddy Evans contacted vendors and visited facilities from refineries to power plants for inspiration. Based on their findings, the team landed on a solution that was simple but effective: a metal clamp with a long handle that technicians can engage without removing the motor cover. The clamp holds the shaft securely and ensures that techs are never exposed to fast-turning parts.
The equipment had previously been used for cooling towers in regions that experience hurricanes, where high winds can make fans spin at dangerous speeds, causing serious damage. Now, CF’s vendor is marketing the clamp, with CF’s suggested modifications, as a safety device for other customers with cooling towers. The solution can be used at any of our manufacturing plants — where we have over 100 such fans — and is on its way to becoming a new industry standard.
Our Safest Year Ever
Manufacturing nitrogen products responsibly requires an unwavering focus on safety. For CF, safety is more than just a requirement — it is a point of pride and ingrained in our corporate culture and values. In 2017, this commitment translated into our safest year ever by every measure.
It starts with our “Do It Right” strategy, which includes equipping our employees with the proper safety knowledge, tools and procedures, and a culture that encourages employees to act with safety in mind every time they come to work.
Employees are the most important part of our safety process. Everyone who works in our production and distribution facilities receives regular safety and process operation training. This includes annual EHS training and testing that focuses on daily operations, as well as emergency response and hazardous materials management.
Continuous improvement is integral to our strategy. In 2017, we strengthened our emergency response procedures in response to hurricanes that caused record levels of damage along the U.S. Gulf Coast. We coordinate with employees, communities and federal and state agencies to ensure that plants can be shut down safely and in a timely manner when a storm is imminent. These changes augment our existing strategies for response to other emergency situations such as brushfires, tornadoes and earthquakes, which could affect our operations in other regions.
Interactive ChartSelect the title on the left to view its chart data.
- Total Injuries
- Recordable Rate
- DART Rate
- LTI Rate
Source: Internal CF Data
* If the employee received medical treatment beyond first aid for a work-related injury, that is recorded as a recordable incident.
Source: Internal CF Data
* According to the Occupational Safety and Health Administration (OSHA), incidence rates can be used to show the relative level of injuries and illnesses among different industries, firms or operations within a single firm. Because a common base and a specific period of time are involved, these rates can help determine both problem areas and progress in preventing work-related injuries and illnesses. An incidence rate of injuries and illnesses may be computed from the following formula: (Number of injuries and illnesses X 200,000) / Employee hours worked = Incidence rate. The 200,000 figure in the formula represents the number of hours 100 employees working 40 hours per week, 50 weeks per year would work, and provides the standard base for calculating incidence rate for an entire year.
Source: Internal CF Data
* If the employee cannot return to work following the day a work-related injury occurred or illness began, that is recorded as a lost time incident.
Source: Internal CF Data
Safety Milestones
4 Million
Hours Worked without a Lost-Time Injury in 2017
Hours Worked without a Lost-Time Injury in 2017
Years without
Lost-Time Injury
Lost-Time Injury
Brandon Terminal20 Years
Huntington Terminal 45 Years
Seneca Terminal 50 Years
Source: Internal CF Data
A Safe Network
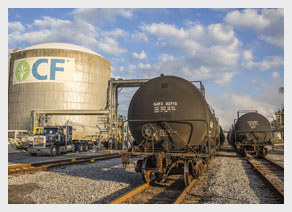
Taking responsibility for safety doesn’t end at our facilities. We work to ensure that our products are safe across all of our shipping modes and even when they reach retailers. When shipping by rail, CF ensures that cars are maintained, products are safely loaded and valves and caps are properly secured.
This commitment was recently recognized by three of our rail carriers. CF received the 2017 Thoroughbred Chemical Safety Award from Norfolk Southern,the Chemical Safety Excellence Award from CSX Corporation and the Safe Handling Award from Canadian National.
Once our products reach agricultural distributors, they must be stored and handled with care. CF participates in and is on the Board of ResponsibleAg, an independent nonprofit that helps retailers comply with federal safety regulations.
Efficiency at Every Step
Environmental stewardship is inherent to our operations. Manufacturing nitrogen products requires an energy-intensive process, known as the Haber-Bosch process, that converts natural gas and atmospheric nitrogen into ammonia. That is why we work constantly to improve energy efficiency at every stage of production.
Our natural gas-based process is cleaner and results in lower emissions than the coal that is used in many other parts of the world. Greater efficiency also results from ongoing capital investments in technology and equipment within our plants. These have included voluntary investments in carbon capture and nitrous oxide abatement technologies to reduce GHGs. It’s an approach that has paid off in recent years as we have reduced CO2 emissions per metric ton of product by 30 percent from 2012 through 2017.
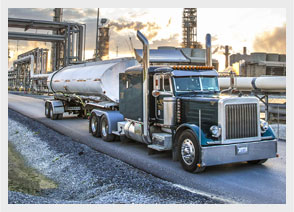
Efficient Distribution Options
Our focus on energy efficiency extends to our distribution network that is designed to move product over greater distances with less impact. CF’s distribution facilities are located close to North America’s major crop-growing regions. With multiple transport modes available, we typically utilize the options that make most sense in terms of fuel efficiency and carbon footprint. Some of our product is moved through pipeline, which in most cases is more energy- and cost-efficient than truck, barge or rail transport.
Fuel Efficiency by Transport Mode To move 1 ton of cargo, these transport types can travel:
-
Truck0 miles/gallon of fuel
-
Train0 miles/gallon of fuel
-
Barge0 miles/gallon of fuel
Source: National Waterways Foundation Study
Extending Our Impact
We regularly invest in technology that helps reduce nitrous oxide emissions, which has drawn the attention of Cool Effect (http://www.cooleffect.org), an environmental nonprofit that allows individuals to “crowdfund” emissions-reducing projects. Cool Effect enables individuals to purchase the N2O abatement credits that the N2O reduction project at our Yazoo City, Mississippi, plant generates. We then donate the proceeds from those credits to The Nature Conservancy’s work on the 4R Plus Program to improve soil health and water quality in Iowa.

Staying Accountable for Our Progress
In the U.K., CF discloses the carbon footprints of all fertilizers and certifies them to the rigorous Publicly Available Standard 2050 (PAS 2050). Certification ensures maximum credibility of our carbon footprints and provides a baseline against which to measure our decreasing impact.
Smart Water Use In Our Operations
Operating responsibly includes being good stewards of our manufacturing inputs, including water. An essential part of the ammonia production process is the use of steam with natural gas to produce hydrogen, a key ingredient. Also, steam and cold water are essential for driving turbines and keeping equipment at the right temperature for efficient operations. Furthermore, water is a raw material additive for aqua ammonia and DEF. See how water circulates through a CF manufacturing plant.
Roll Over Each Step
to learn how water
circulates through our
manufacturing plants.
Water enters a CF plant
from rivers, wells or
nearby cities.
Water is heated and
converted to steam,
which is used in all of our production facilities. This water
is captured and recycled in the steam process.
Water is also used in cooling towers, where it is reused
multiple times.
After several uses, water is
sent to a treatment facility
where we adjust pH and
remove sediments and solids
Water is returned to area
water bodies according to
local regulatory discharge requirements.
Source: Internal CF Data
Water Intensity
2.26 Cubic Meters
of new water used/metric tonne of product
CF is aggregating its water intensity data for the first time in 2017. This figure includes a combination of direct flow measurements and engineering estimates.
Source: Internal CF Data
Our Greenhouse Gas Impact
helping to save the world >300 million tonnes of CO2e
CF’s recent capacity expansions have displaced Chinese
production, which is three times more GHG intensive.
In 2017, CF achieved its
lowest greenhouse gas
emissions intensity ever.
lowest greenhouse gas
emissions intensity ever.
CO2e Emissions/Product Tonne (Tonnes CO2e/Tonne of Production)
Source: Internal CF Data: Corporate Greenhouse Gas Inventory Report for CF Industries 2017; Ruby Canyon
CF’s 2017 greenhouse gas emissions
were driven by its recent $5 billion
investment in capacity expansions.
were driven by its recent $5 billion
investment in capacity expansions.
CO2e Emissions (Million Metric Tonnes of Total Plant CO2e)
Source: Internal CF Data: Corporate Greenhouse Gas Inventory Report for CF Industries 2017; Ruby Canyon
CF’s capacity expansions
replace anthracite coal-based
production in China.
replace anthracite coal-based
production in China.
4.2 Million Tonnes CO2e Saved Annually (Million Metric Tonnes CO2e)
Source: Internal CF Data
Synthetic fertilizer reduces GHG
emissions by increasing crop yields
and preventing deforestation.
emissions by increasing crop yields
and preventing deforestation.
4.9 Gigatonnes CO2e Saved (Gt CO2e)
Sources: UN Intergovernmental Panel on Climate Change; UN Food and Agriculture Organization
While carbon emissions are an unavoidable chemical byproduct of ammonia production, the level of equivalent carbon dioxide emissions (CO2e) generated is tied to the type of feedstock used: natural gas in the case of CF or anthracite coal by producers in China.
With China decreasing production capacity in response to recent expansions (including those at CF), we estimate that at least 4.2 million tonnes of CO2e has, in effect, been avoided.
Source: Internal CF Data
Our GHG Lifecycle Emissions in Context
The key is to increase yields per acre so as to maximize food production, while minimizing the land area
required for cultivation. Synthetic fertilizers are part of the solution, not part of the problem. But what if
farmers used no synthetic fertilizer — would we see a reduction in global GHG emissions?


~30%more farmland
needed to
grow food
needed to
grow food

Resulting deforestation
clears carbon dioxide
-consuming trees
clears carbon dioxide
-consuming trees

Deforestation
causes increase of
nearly 5 gigatonnes
of carbon dioxide
equivalent emissions
(GtCO2e)
causes increase of
nearly 5 gigatonnes
of carbon dioxide
equivalent emissions
(GtCO2e)

Increase in
global GHG
emissions by
almost 10%
global GHG
emissions by
almost 10%
Fertilizer & Deforestation
With the world population expected to hit 9.8 billion people by 2050, fertilizer will
play a critical role in feeding the world in a sustainable manner.
1970 > 2016
-
Crop Yield
Through Synthetic
Fertilizer +~30% -
Global Corn,
Wheat and Barley
Production +180.3% -
Land Available
for Corn, Wheat
and Barley +17.5%
Source: FAOSTAT and Internal CF Data